Data Release 1 is Now Avilable!
While the primary science driver for HASHTAG is the dust continuum science, how this releates to the gas is important, and the CO(J=3-2) line can also be a significant contaminant of the 850µm band. To make sure we cover a range of conditions across M31 we use pointings across a range of locations and environments to ensure we measure a range of conditions (these are shown in the Figure below).
For all but one regions we observed using HARP 2' × 2' Jiggle maps to create small fully sampled maps, and a 4' × 4' raster map. The fields were selected to include:
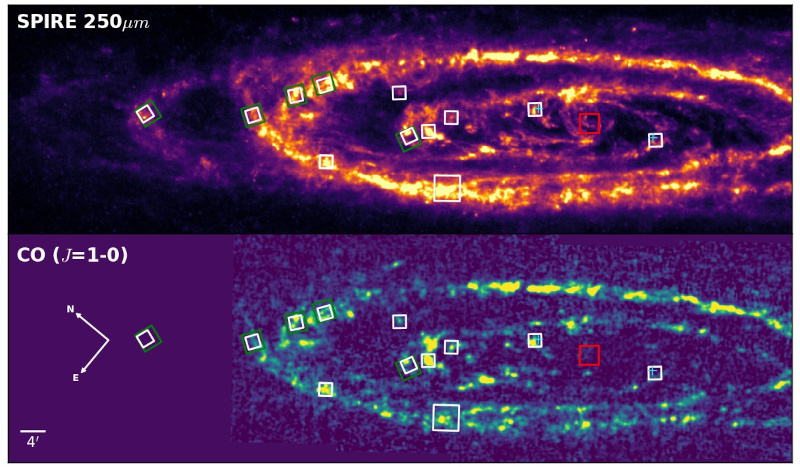
In total these 12 regions will cover an area of 60 square arcminutes, and several memeners of the team have a complimentary survey to observe the bulge. Our observations are designed to reach an antenna temperature of 13 mK with a 2.6 km/s channel width. This requres a total of 55 hours of Band 3 time.
Data Release 1 is Now Avilable!
If you from one of the EAO partners and want to get involved, go to the team page, and find your local contact. If you have any other questions about HASHTAG you can use the contact details below, or if you hvae a specific question about a paper contact the lead author.
The JCMT is operated by the East Asian Observatory association. For more information about the JCMT and EAO click on the icon below.