Data Release 1 is Now Avilable!
The HASHTAG observing strategy was based on our experience of from our SCUBA-2 pilot survey in 2015. For the pilot field we choose to use a 30 arcmin (diamter) pong as this provided a good balance between depth and including a significant background region. Each observation is observed for 43 minutes, which we then repeated 37 times. This produced mapswith a sensitivity of 44.9 mJy beam-1 and 3.0 mJy beam-1, at 450 and 850µm, respectively (using 2.0 and 4.0 arcsecond pixels). Our initial reduction is shown in the Figure below.
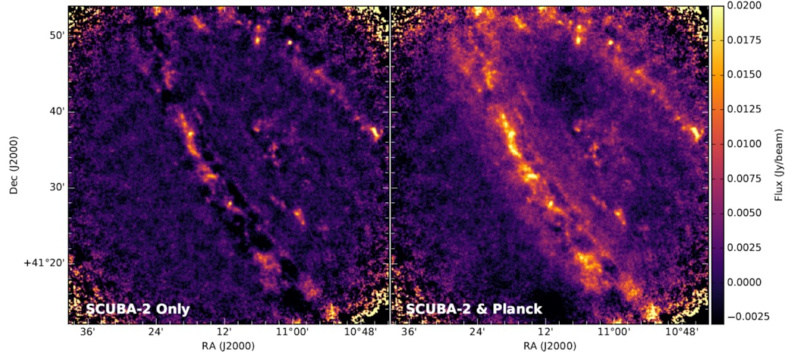
A limitation of ground-based sub-mm astronomy is that due to atmosphere variations filtering is required which attenuates emission on the largest-angular scales. Ground-based observations are needed as we can build much bigger telescopes on the ground than we can put in space (and hence much better resolution). To overcome the limitations of the atmosphere we take the lower-Resolution space-based date (but includes the large-scale emission), and combine it with the ground-based data to obtain an image with both the high-resolution and large-scale information (using a feathering technique). For more information on this process see our data reduction paper, and our software page.
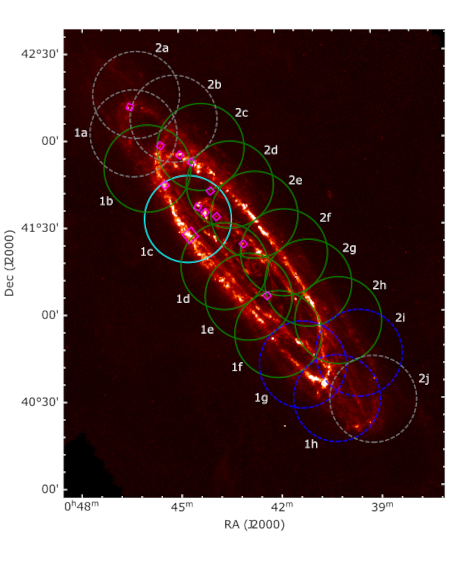
For the full HASHTAG project we decided to keep to a similar strategy, again using 30 arcmin pongs including similar areas of 'background'. To cover the entirity of Andromeda we created a set of 18 overlapping pongs with two rows just above and below the major axis (see Figure below). At all positions every point is covered by at least two pong positions, with each pong repeated 17 times (half our pilot field). This strategy has many advatantages; first it helps ensure we do not have areas of low coverage, second as the two rows overlap in the centre we have good sensitivity in an area where we expect less dust, and third the large number of overlaps between observations is optimal for the data processing. As we are also interested in looking for transients we try to have a temporal gap between sets of repeats.
Data Release 1 is Now Avilable!
If you from one of the EAO partners and want to get involved, go to the team page, and find your local contact. If you have any other questions about HASHTAG you can use the contact details below, or if you hvae a specific question about a paper contact the lead author.
The JCMT is operated by the East Asian Observatory association. For more information about the JCMT and EAO click on the icon below.